Spectral Analysis of Compounds
Overview
The project aims to develop a spectral analysis system for the identification and quantification of elements present in mixtures. The system allows users to select areas of interest in an image and analyze the spectral reflectance of those areas across different spectral bands. This way, it is possible to check the proportion, classify, and categorize the elements in the analyzed composition. In addition to manual selection, the system also performs automatic selection of areas of interest, optimizing the analysis process.
Objectives
- Identify the elements present in the mixture through spectral analysis.
- Classify the image pixels according to their spectral characteristics.
- Evaluate the spatial distribution of the elements in the image.
- Quantify the occurrence of each element in specific regions.
- Generate detailed graphs of the spectral analysis.
Methodology
Image Acquisition and Processing
- Spectral images are captured and processed to enhance the bands of interest.
- The system allows both manual and automatic selection of areas of interest for detailed analysis.

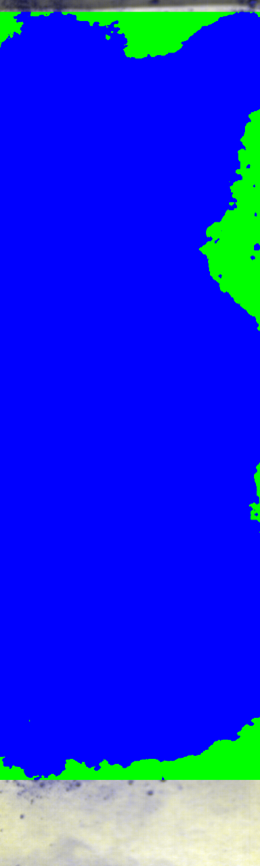
Example of a spectral image with automatic selection of areas of interest.
Machine Learning Classification
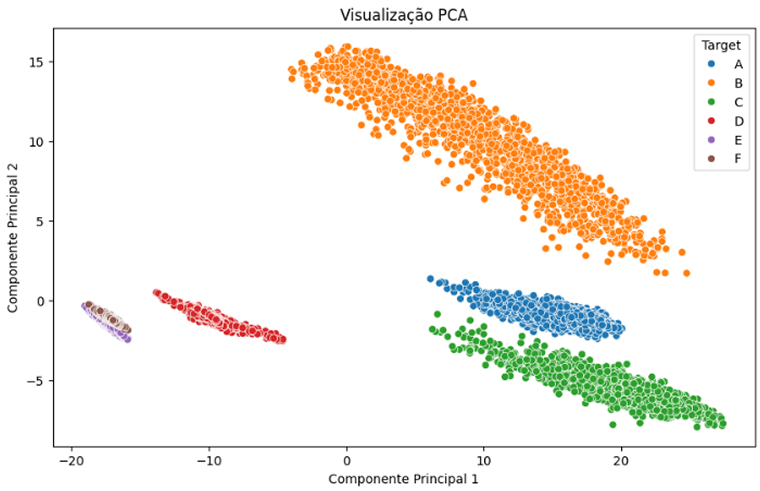
- The SVM (Support Vector Machine) model is used to classify the image pixels.
- The pixels are categorized into different classes corresponding to the elements present in the mixture.
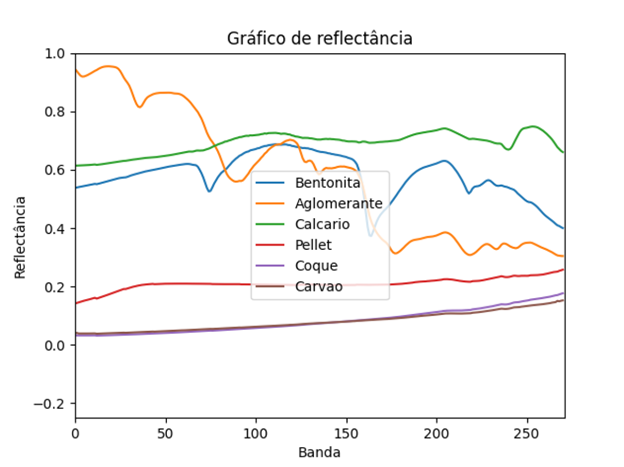
Graph illustrating the classification of elements by the SVM model.
Spatial Analysis of Element Distribution
- The image is segmented into quadrants for the evaluation of spatial homogeneity.
- The standard deviation of spatial coherence within each quadrant is calculated.
- Graphs are generated to represent the distribution of the elements.
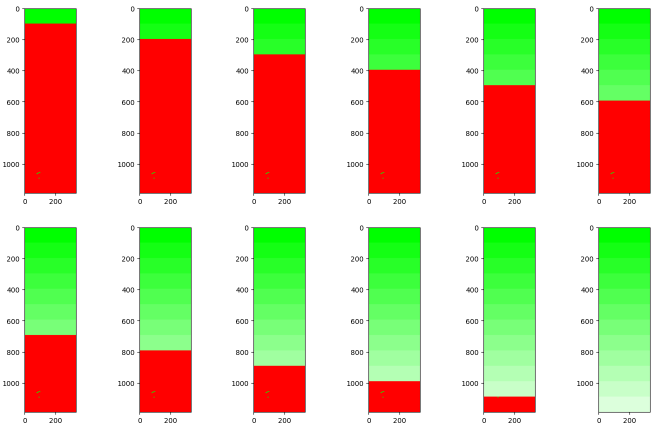
Spatial distribution of elements with coherence analysis.
Results
The tests conducted demonstrated the effectiveness of the system in classifying and quantifying the elements present in the analyzed mixtures. The main results include:
- Accurate classification of pixels into different spectral categories.
- Identification of the proportion of each element within the sample.
- Spatial homogeneity analysis, assisting in evaluating the distribution of the compounds.
- Generation of detailed graphs for the visualization and interpretation of spectral data.
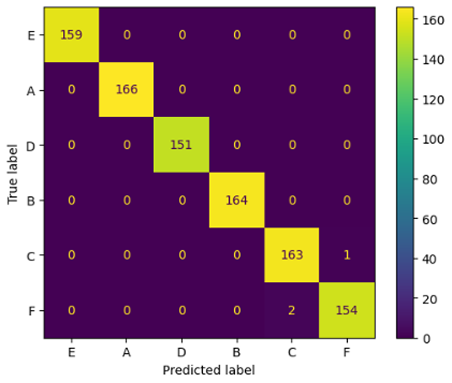
Graphs representing the accuracy of the classifications.
Technologies Used
- Language: Python
- Libraries: OpenCV, Scikit-Learn, NumPy, Matplotlib
- Techniques: Image processing, machine learning (SVM), spectral analysis, graph generation